
Page 139 - OUSD LCAP 2015-2016
P. 139
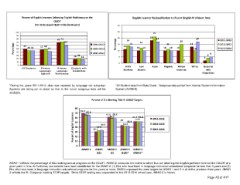
Percent of English Learners Achieving English Proficiency on the English Learner Reclassification to Fluent English Proficient Rate
CELDT
30
(Per Data Quest CELDT Criterion Report)
10 0 25 21
18 17
90
Asian
80 69 71 20 17
62 13
Percentage70 14 12 11 15 2011-2012
Percentage 15 13 10 10 10 10 10 10 2012-2013
60 49 44 44 47 48 42 2011-2012 2013-2014
50 2012-2013 11
P rimary 2013-2014
40 Language: 10
30 Spanish 18 21 16 5 45
2
20
0
10
0
0 P rimary S t ude nt s wit h Low Hispanic African White Students
Language D isabilities All EL Income American with
A ll Students Vietnamese Students
Disabilities
*During the years 2011-2014, data was reported by language not subgroup. *All Student data from Data Quest. Subgroup data pulled from internal Student Information
Systems are being put in place so that in the future subgroup data will be System (AERIES).
available.
Percent of ELs Meeting Title III AMAO Targets
80
Percent of English Learners 70 69.2 65.6 61.5 58.6
65.1 59.5
60 52.1 51.8 2011-2012
44 42.4 51.8 2012-2013
50 2013-2014
33.5 42.4
40 32.9
30.4
30
20
10
0 AMAO AMAO 2 AMAO 3 AMAO 3
AMAO 1 2(1) (2) (ELA)* (Math)*
AMAO 1 reflects the percentage of ELs making annual progress on the CELDT. AMAO 2 measures the extent to which ELs are attaining the English proficient level on the CELDT at a
given point in time. In California, two cohorts have been established for the AMAO 2: (1) ELs who have been in language instruction educational programs for less than 5 years and (2)
ELs who have been in language instruction educational programs for five years or more. OUSD surpassed the state targets for AMAO 1 and 2 in all of the previous three years. AMAO
3 reflects the EL Subgroup meeting STAR targets. Since STAR testing was suspended for the 2013-2014 school year, AMAO 3 is frozen.
Page A5 of A17