
Page 114 - OUSD LCAP 2016-19
P. 114
Page 100 of 119
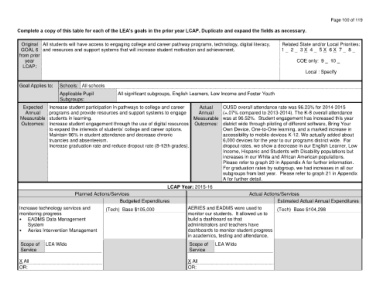
Complete a copy of this table for each of the LEA’s goals in the prior year LCAP. Duplicate and expand the fields as necessary.
Original All students will have access to engaging college and career pathway programs, technology, digital literacy, Related State and/or Local Priorities:
GOAL 6 and resources and support systems that will increase student motivation and achievement. 1 2 3 X 4 5 X 6 X 7 8 8
from prior
year COE only: 9 10 0
LCAP:
Local : Specify
Goal Applies to: Schools: All schools
Applicable Pupil All significant subgroups, English Learners, Low Income and Foster Youth
Subgroups:
Expected Increase student participation in pathways to college and career Actual OUSD overall attendance rate was 96.23% for 2014-2015
Annual programs and provide resources and support systems to engage Annual (+.07% compared to 2013-2014). The K-8 overall attendance
Measurable students in learning. Measurable was at 96.52%. Student engagement has increased this year
Outcomes: Increase student engagement through the use of digital resources Outcomes: district wide through piloting of different software, Bring Your
to expand the interests of students’ college and career options. Own Device, One-to-One learning, and a marked increase in
Maintain 96% in student attendance and decrease chronic accessibility to mobile devices K-12. We actually added about
truancies and absenteeism. 6,000 devices for the year to our programs district wide. For
Increase graduation rate and reduce dropout rate (8-12th grades). dropout rates. we show a decrease in our English Learner, Low
Income, Hispanic and Students with Disability populations but
increases in our White and African American populations.
Please refer to graph 20 in Appendix A for further information.
For graduation rates by subgroup, we had increases in all our
subgroups from last year. Please refer to graph 21 in Appendix
A for further detail.
LCAP Year: 2015-16
Planned Actions/Services Actual Actions/Services
Budgeted Expenditures Estimated Actual Annual Expenditures
Increase technology services and (Tech) Base $105,000 AERIES and EADMS were used to (Tech) Base $104,298
monitoring progress monitor our students. It allowed us to
• EADMS Data Management build a dashboard so that
System administrators and teachers have
• Aeries Intervention Management dashboards to monitor student progress
in academics, testing and attendance.
Scope of LEA Wide Scope of LEA WIde
Service Service
X All X All
OR:------- OR: